EyeOTmonitor’s Dashboards provides users with a user-friendly and customizable interface to monitor and manage your devices and network in real-time. With advanced data visualization, alerting features, and seamless integration options, it empowers businesses and researchers to efficiently collect and analyze data, enabling data-driven decision-making.
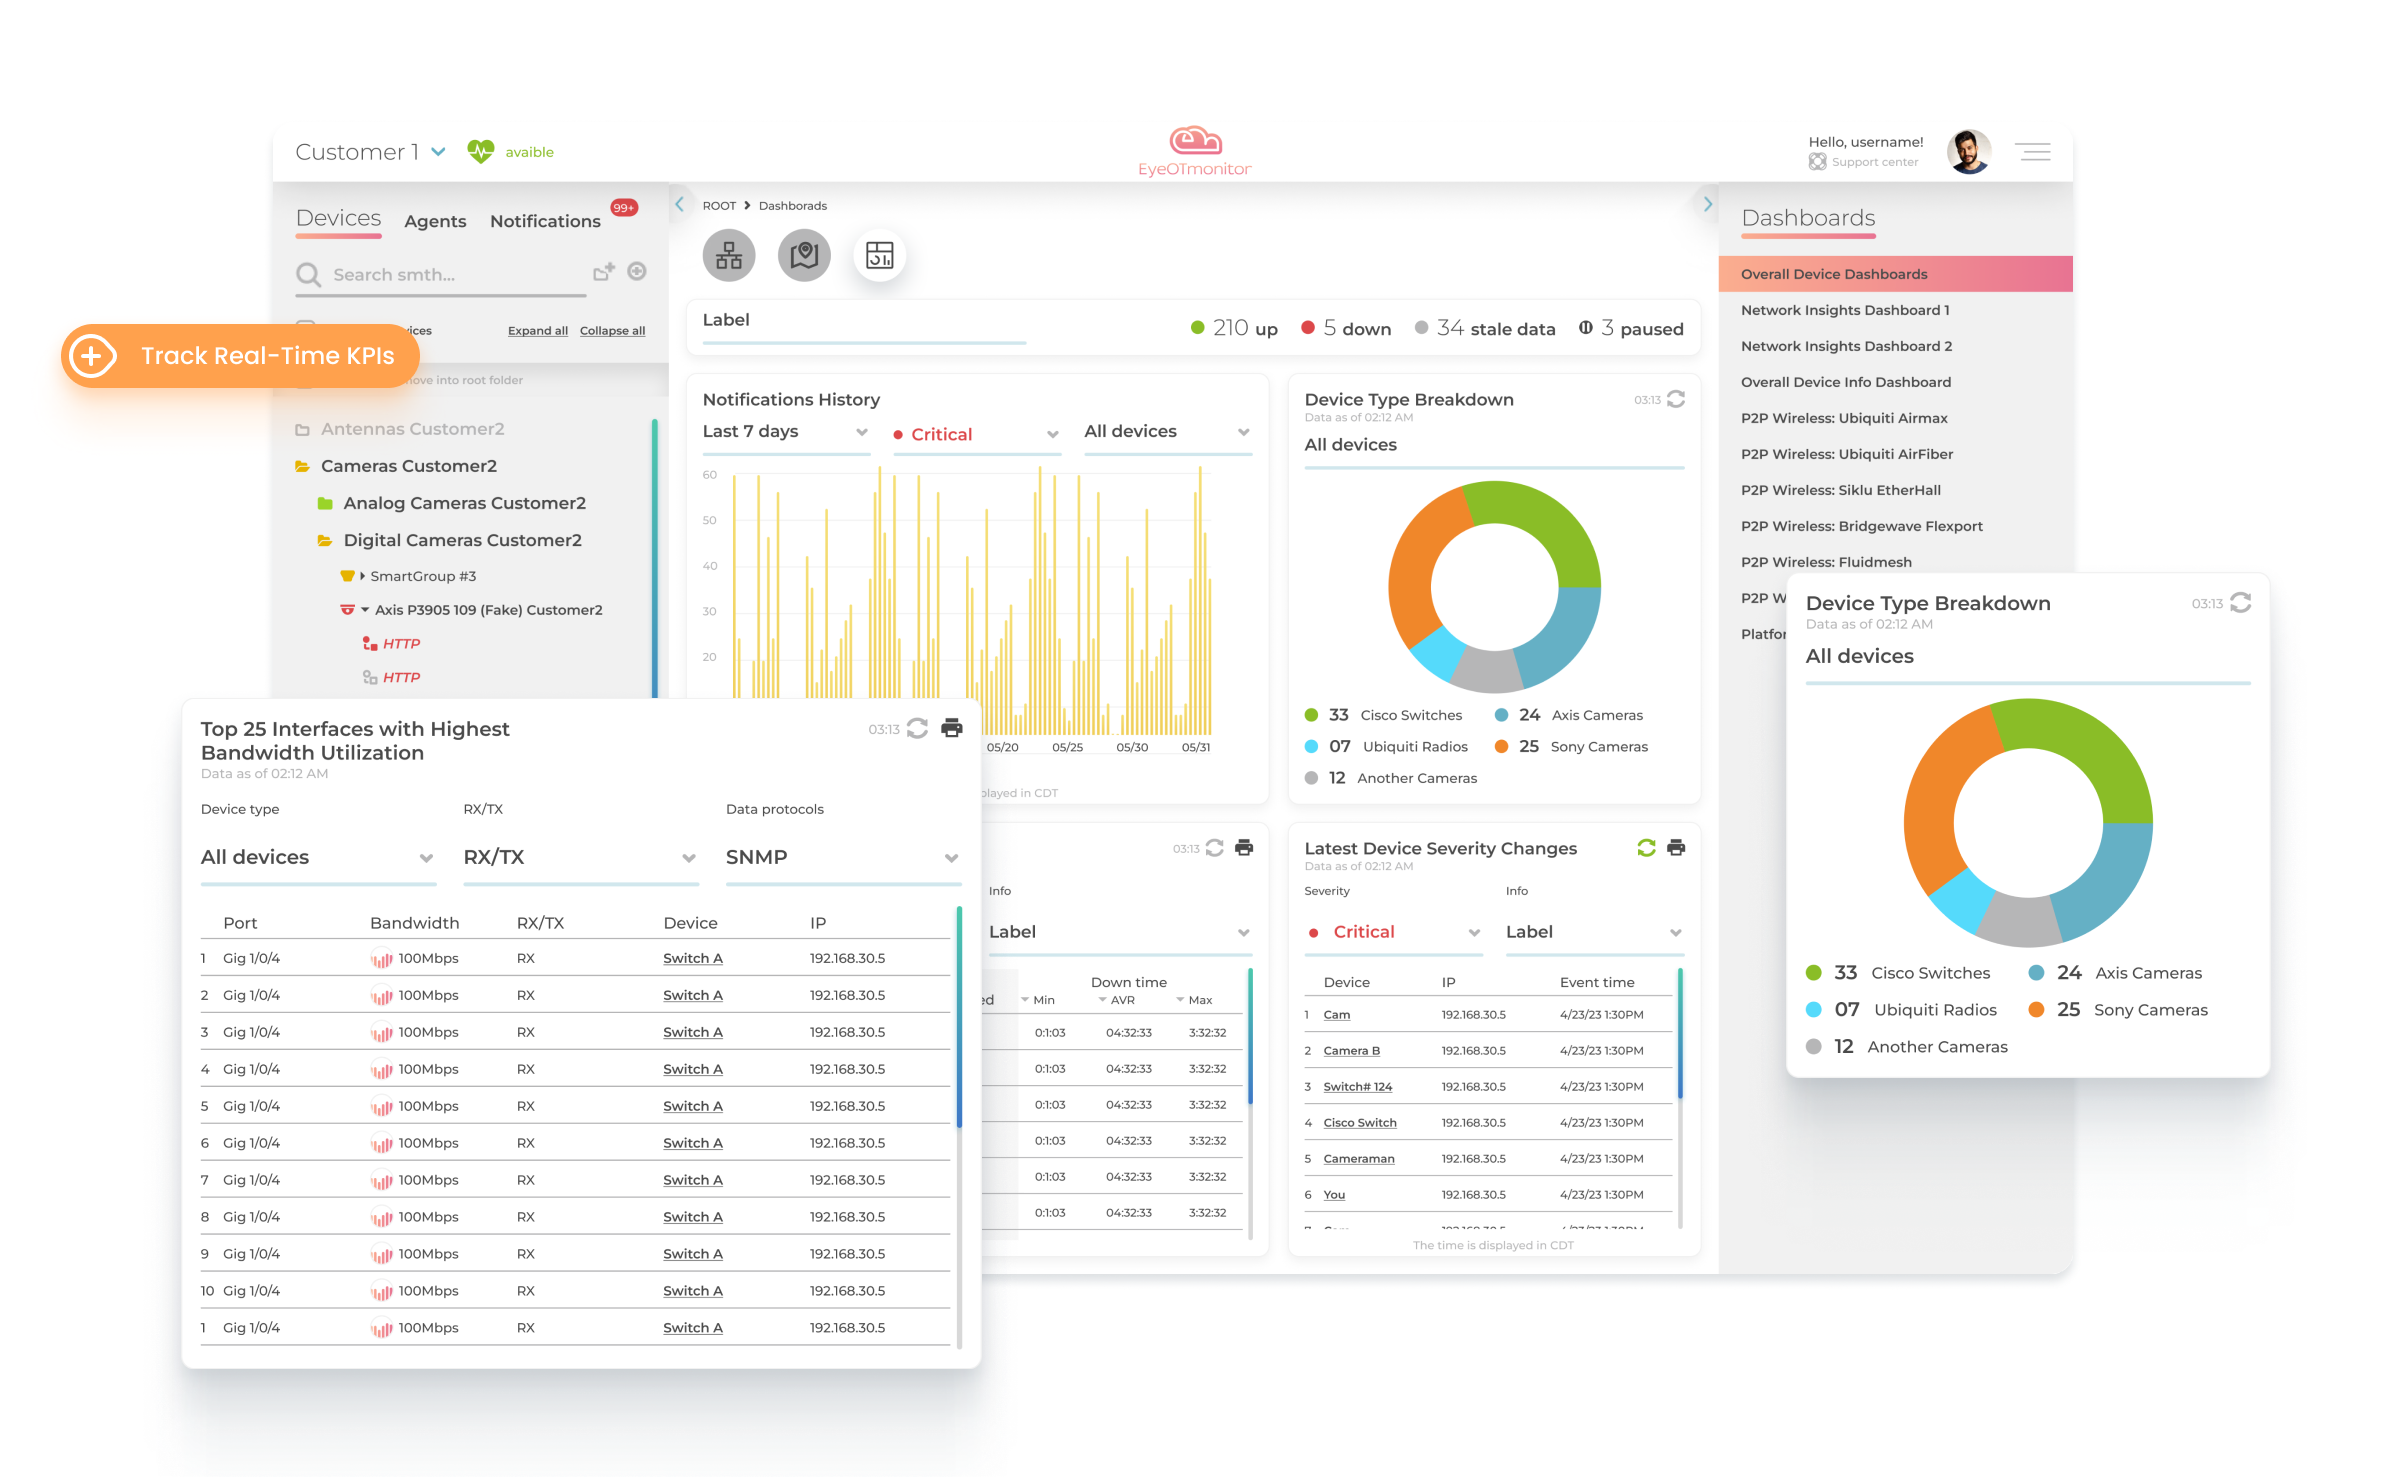
Instant Access to Performance of Your Devices and Network
By utilizing EyeOTmonitor’s dashboard capabilities, organizations can gain a deeper understanding and control over their IoT networks, leading to improved performance, enhanced decision-making, and a more intuitive and efficient management process.
Real Time Data Visualization
Centralized Monitoring
Customized Reports
Improved Decision Making
Enhanced Efficiency
Historical Data Analysis and Trend Identification
Flexible and Customizable
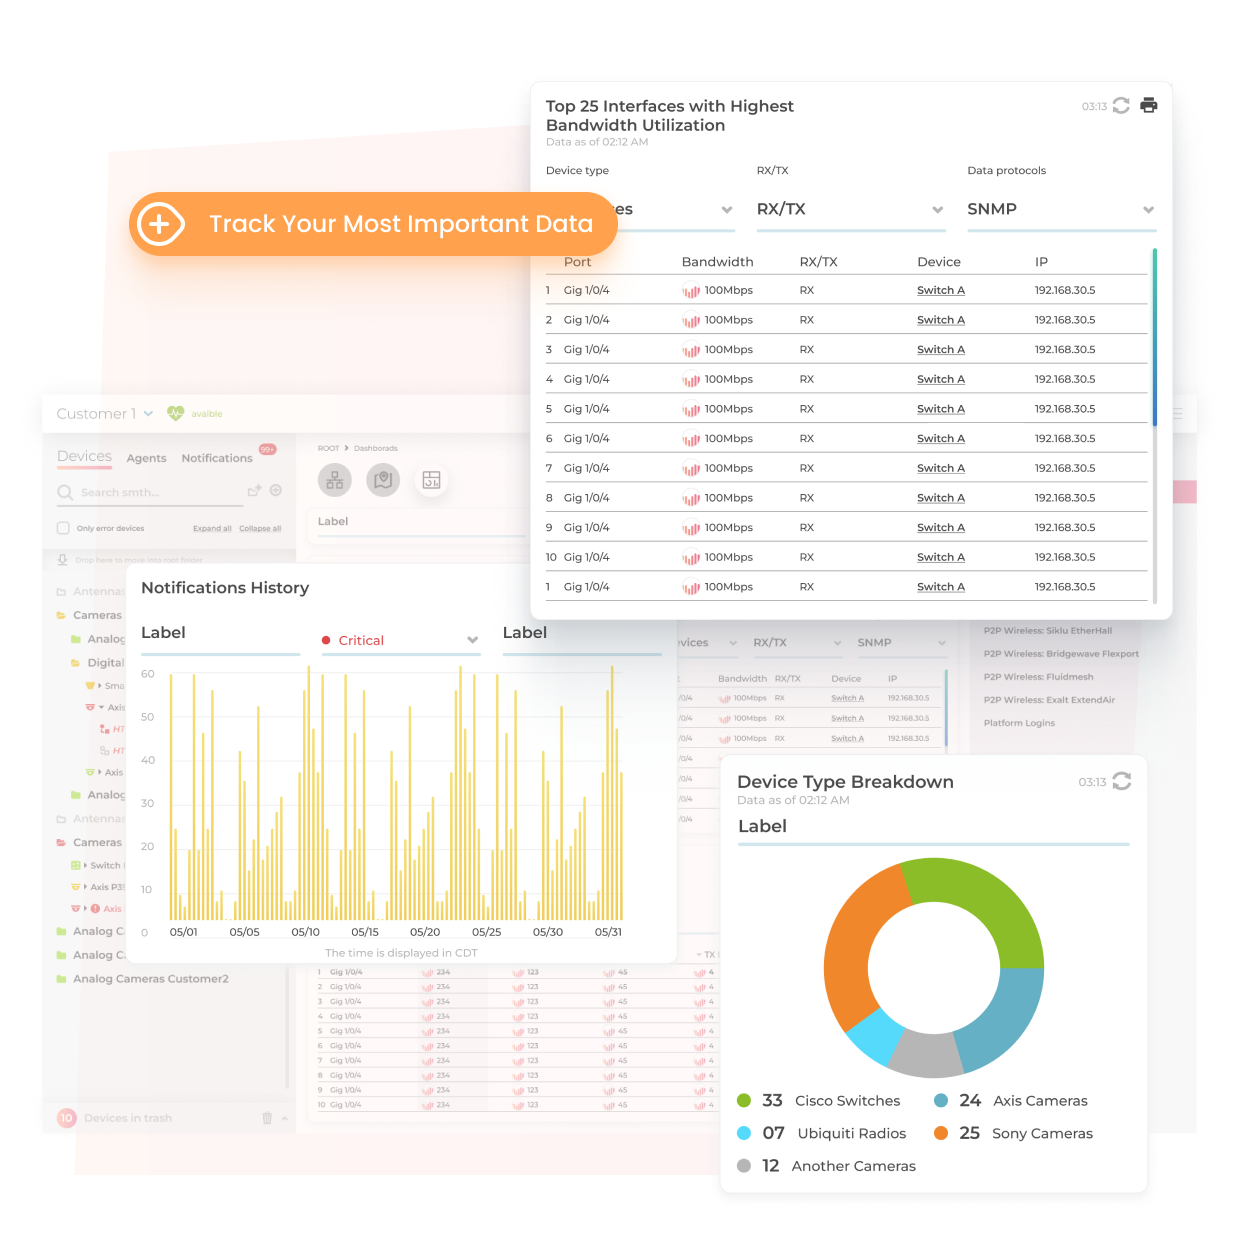
Track Unlimited KPIs
Create Custom KPIs with multiple charts and graphs. Build a single KPI that aggregates device or software data from multiple customers.
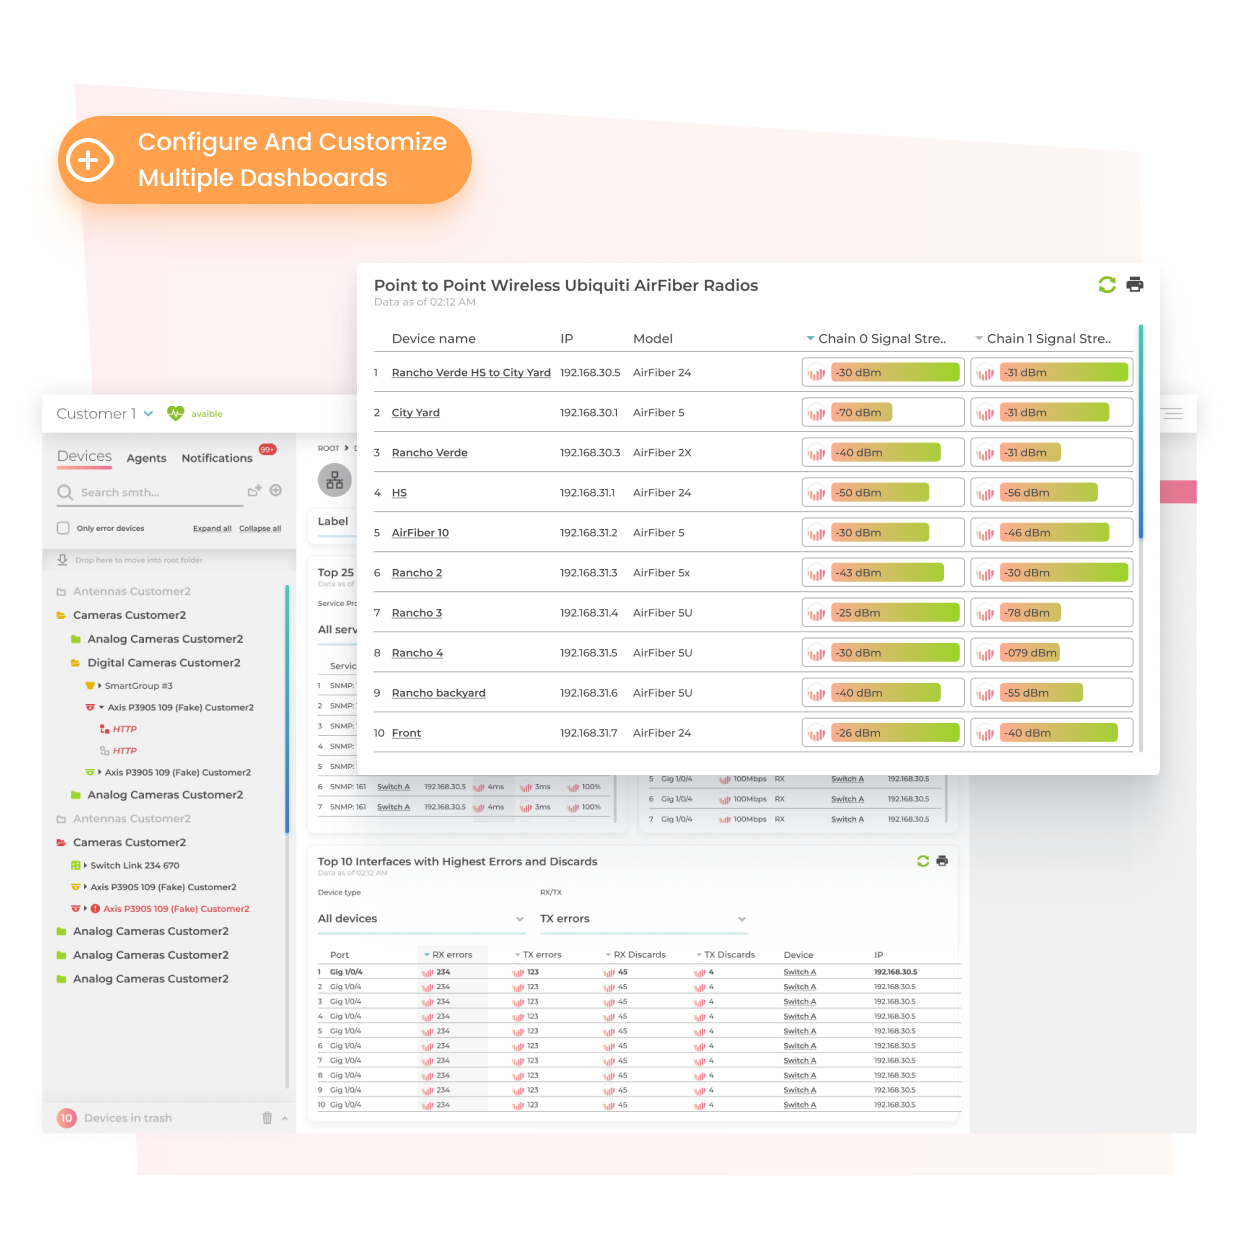
Solutions-Driven
Custom Dashboards
Create solutions-driven custom dashboards. Share dashboards with customers and internal support teams.
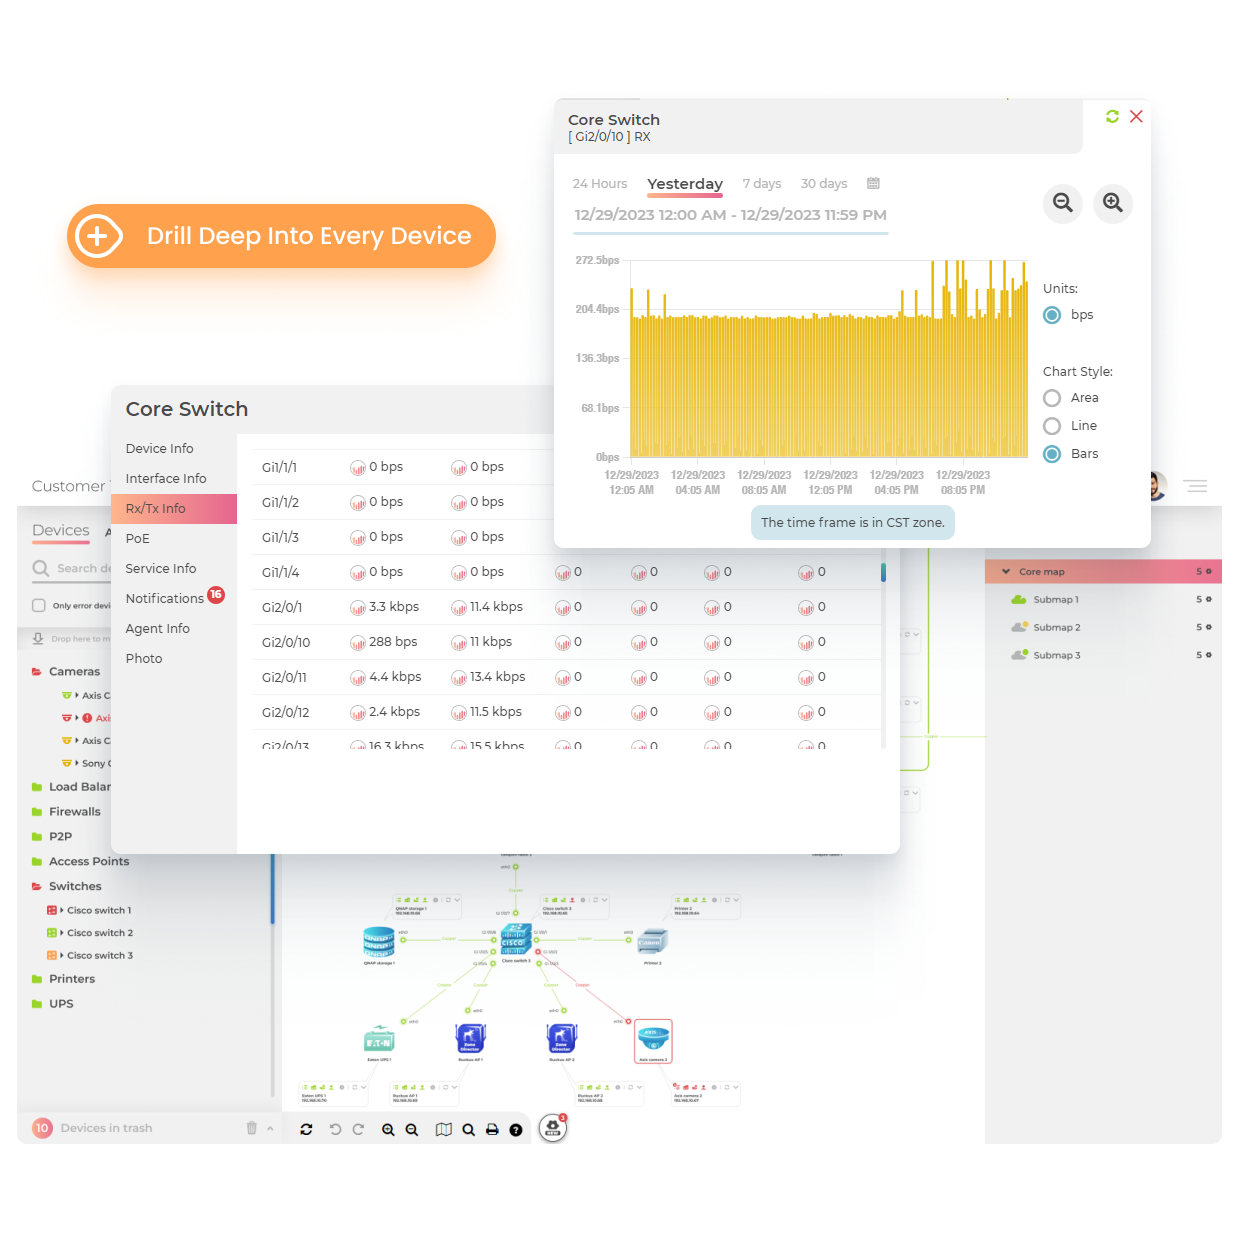
Deep Insights
Historical Performance of Your Devices
Beyond real-time data, dashboards allow users to access historical data, enabling them to analyze trends over time, predict future patterns, and make more strategic long-term decisions.
More Features
Explore the Rest of EyeOTmonitor
Topology Maps
Build fast, responsive maps effortlessly within the user-friendly logical interface.